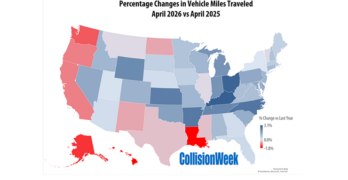
Drivers logged more miles year-over-year even as pump prices surged on the war with Iran. Rolling 12-month traffic at record levels. Traffic volume in April was up in the U.S. overall, with drivers logging more miles than a year earlier even as gasoline prices climbed sharply in March and April amid the war with Iran. […]
U.S. Traffic Volume Up in February Compared to 2025
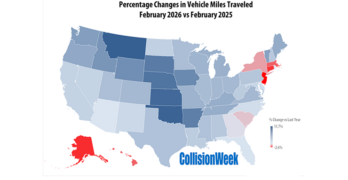
Rolling 12-month traffic at record levels. First two months up year-over-year. Traffic volume in February was up in the U.S. overall even as winter weather events impacted travel in some regions. Travel for the month of February is estimated at 245 billion vehicle miles nationwide according to the most recent data released by the Federal […]
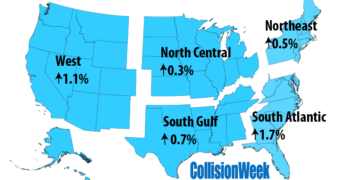
U.S. Traffic Volume Down in February Compared to 2024
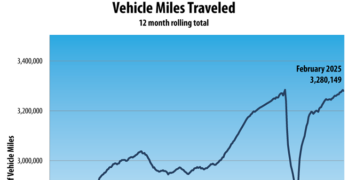
Year-to-date and rolling 12-month traffic through February, however, are up over last year. Traffic volume in February was down slightly in the U.S. overall as winter weather events impacted travel in some regions mid-month. Travel for the month of February is estimated at 237.3 billion vehicle miles nationwide according to the most recent data released […]
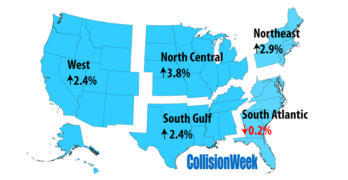
U.S. Traffic Volume Down in September Compared to 2023 as Hurricane Impacted South Atlantic and Gulf Regions
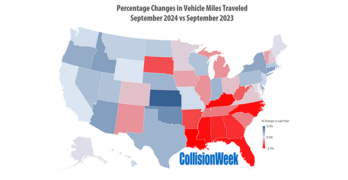
Rolling 12-month traffic through September up over 1% compared to previous year and nearing pre-pandemic peak. Traffic volume in September was down slightly as Hurricane Helene impacted several states in the South Atlantic and South Gulf regions during the last several days of the month. Hurricane Helene made landfall in the Big Bend region of […]
U.S. Traffic Volume Up in May Compared to 2023

Traffic up compared to last year both for the month and year-to-date. Traffic volume in May increased compared to the previous year for the fourth month in a row after declining in January. Traffic volume was above last year, and it was also above May 2019 prior to the impact of the pandemic. Monthly traffic […]
Nearly 71 Million Expected to Travel over July 4th Week
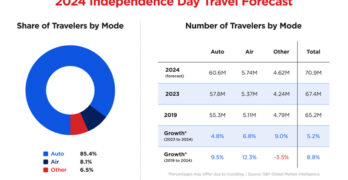
This year’s extended Independence Day forecast exceeds pre-pandemic numbers, sets new record. AAA projects 70.9 million travelers will head 50 miles or more from home over the Independence Day holiday travel period. For the first time, AAA looked at the entire July 4th week, plus the Saturday before and the Sunday after the holiday. This […]
U.S. Traffic Volume Up in December Compared to 2022
Traffic in 2023 was up each month compared to the previous year. Traffic for year above 2019 pre-pandemic peak. Traffic volume in December increased compared to the previous year, keeping alive a streak of 12 year-over-year (YoY) increases that began in January 2023 after two monthly declines at the end of 2022. Traffic volume was […]
U.S. Traffic Volume Up in September Compared to 2022
Traffic up compared to last year both for the month and year-to-date. Traffic volume in September increased compared to the previous year for the ninth month in a row after two monthly declines at the end of 2022. Traffic volume was above last year, and it was also above September 2019 prior to the impact […]
U.S. Traffic Volume Up in May Compared to 2022
Traffic up compared to last year both for the month and year-to-date. Traffic volume in May increased compared to the previous year for the fifth month in a row after two monthly declines at the end of 2022. While traffic volume was above last year, it remained slightly less than 1% below May 2019 prior […]
Return to Office Trip Data Show Emerging Trends
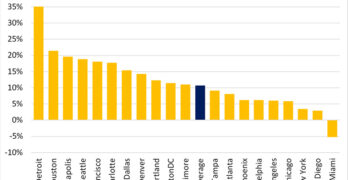
INRIX research shows that downtown trips in just two major cities have exceeded pre-pandemic levels. According to INRIX, the mobility data analytics company, downtown travel continues to experience the most variance across the U.S. with a small number of cities seeing pre-pandemic level downtown trips. COVID-19 had a substantial impact on nearly every dynamic of […]
- 1
- 2
- 3
- …
- 8
- Next Page »